Pulse Charts & Analytics
**20+ chart layouts ready for your next metrics dashboard.**
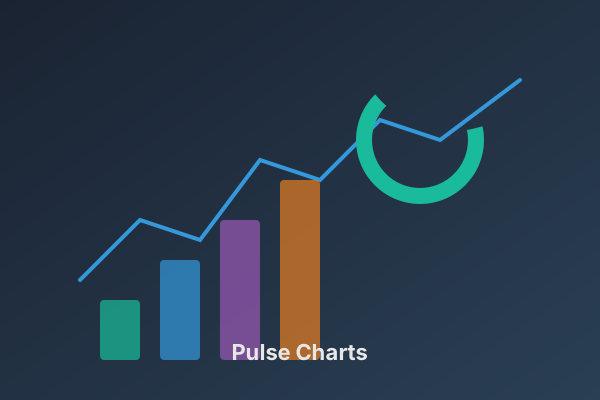
Pulse Charts & Analytics is a curated Gentelella v4 package focused on ECharts visualization. Live preview includes interactive chart tabs, notification dropdown, export buttons, and date range filter UI.
**What's included:** full `package/` source, dedicated chart pages, analytics widgets, MIT license, and Colorlib attribution.
Open index.html — interactive Chart.js analytics dashboard with tabbed chart views. No npm for the preview.
- Web hosting to publish the static demo
- Text editor for quick copy and styling changes on index.html
- For full 58-page customization: Node.js 18+, then cd package && npm install && npm run dev
- Optional: custom domain
- Modern browser for the included static demo
- Node.js 18+ only if you edit the full source in package/
- Backend API or authentication
- Database or live data feeds
- Production CI/CD pipeline
- Developers building data-heavy admin UIs
- Product teams needing chart-ready page templates
- SaaS metrics and KPI dashboards
- Sales and revenue reporting interfaces
- Business intelligence and analytics panels
- 20+ ECharts chart types with live demo data
- Interactive preview: Line, Bar, Heatmap, and Funnel tabs
- Analytics dashboard with heatmap, funnel, cohort matrix
- Notification dropdown and export/filter UI in preview
- Full source — 58 pages total
- MIT license with Colorlib attribution included
- ECharts 6.x lazy-loaded on chart pages
- Node.js 18+ required for build step
- Based on open-source admin template (MIT) by Colorlib
Verified buyer reviews
No reviews yet. Be the first — reviews are only accepted from verified purchases.
You may also like
Enter your email below and you'll be redirected to Stripe's secure checkout page to complete payment. No account needed — we'll email your download link right after.