Pulse Charts & Analytics
**20+ chart layouts ready for your next metrics dashboard.**
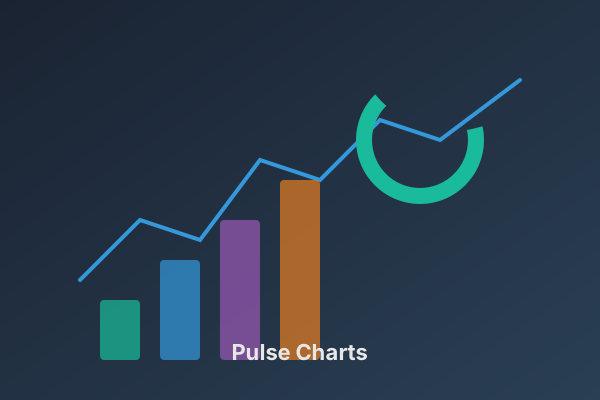
Pulse Charts & Analytics is a curated Gentelella v4 package focused on ECharts visualization. Live preview includes interactive chart tabs, notification dropdown, export buttons, and date range filter UI.
**What's included:** full `package/` source, dedicated chart pages, analytics widgets, MIT license, and Colorlib attribution.
Open index.html — interactive Chart.js analytics dashboard with tabbed chart views. No npm for the preview.
- Web hosting to publish the static demo
- Text editor for quick copy and styling changes on index.html
- For full 58-page customization: Node.js 18+, then cd package && npm install && npm run dev
- Optional: custom domain
- Modern browser for the included static demo
- Node.js 18+ only if you edit the full source in package/
- Backend API or authentication
- Database or live data feeds
- Production CI/CD pipeline
- Developers building data-heavy admin UIs
- Product teams needing chart-ready page templates
- SaaS metrics and KPI dashboards
- Sales and revenue reporting interfaces
- Business intelligence and analytics panels
- 20+ ECharts chart types with live demo data
- Interactive preview: Line, Bar, Heatmap, and Funnel tabs
- Analytics dashboard with heatmap, funnel, cohort matrix
- Notification dropdown and export/filter UI in preview
- Full source — 58 pages total
- MIT license with Colorlib attribution included
- ECharts 6.x lazy-loaded on chart pages
- Node.js 18+ required for build step
- Based on open-source admin template (MIT) by Colorlib
Verified buyer reviews
No reviews yet. Be the first — reviews are only accepted from verified purchases.
Recently viewed
You may also like
Enter your email below and you'll be redirected to Stripe's secure checkout page to complete payment. No account needed — we'll email your download link right after.